
- WELL VISUALISATIONS
- SEISMIC VISUALISATIONS
- IMAGE VISUALISATIONS
- INTERACTIVE SLIDE STORIES
- OSDU INTEGRATION
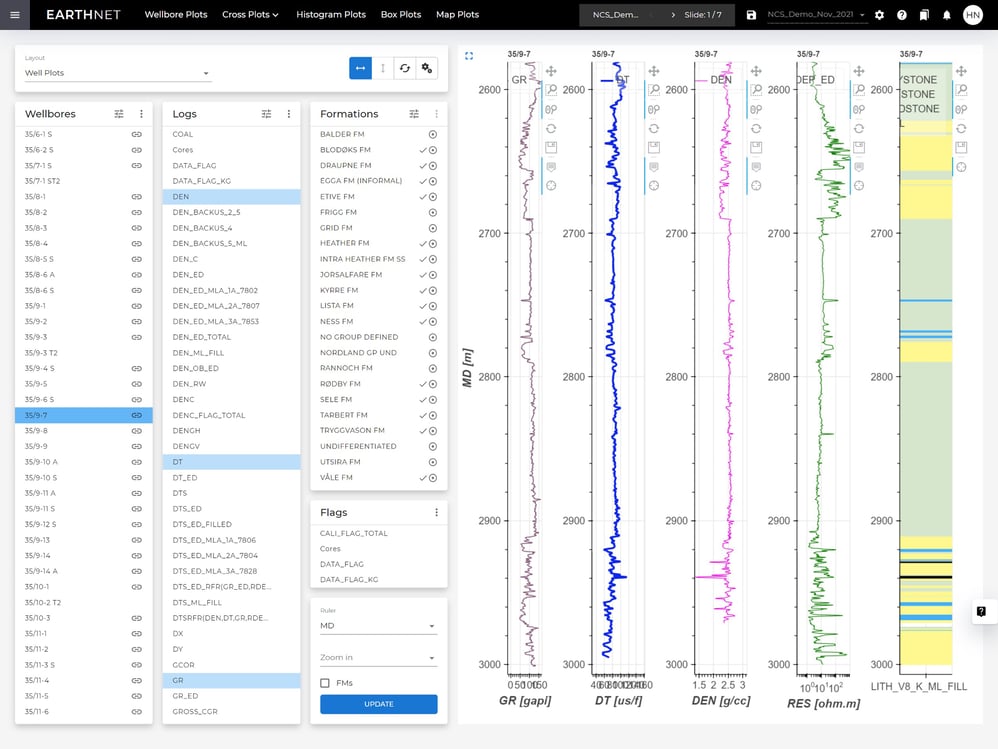
Well visualisations
Visualise well data using well bore plots, histograms, cross-plots, and map plots for an enhanced understanding of your data.
Well bore plots allow you to see the relationship between various parameters at different depths, while histograms provide a quick snapshot of the distribution of a particular variable. Cross-plots can help identify correlations or relationships between different variables, and map plots provide a spatial representation of data across a particular area or region.
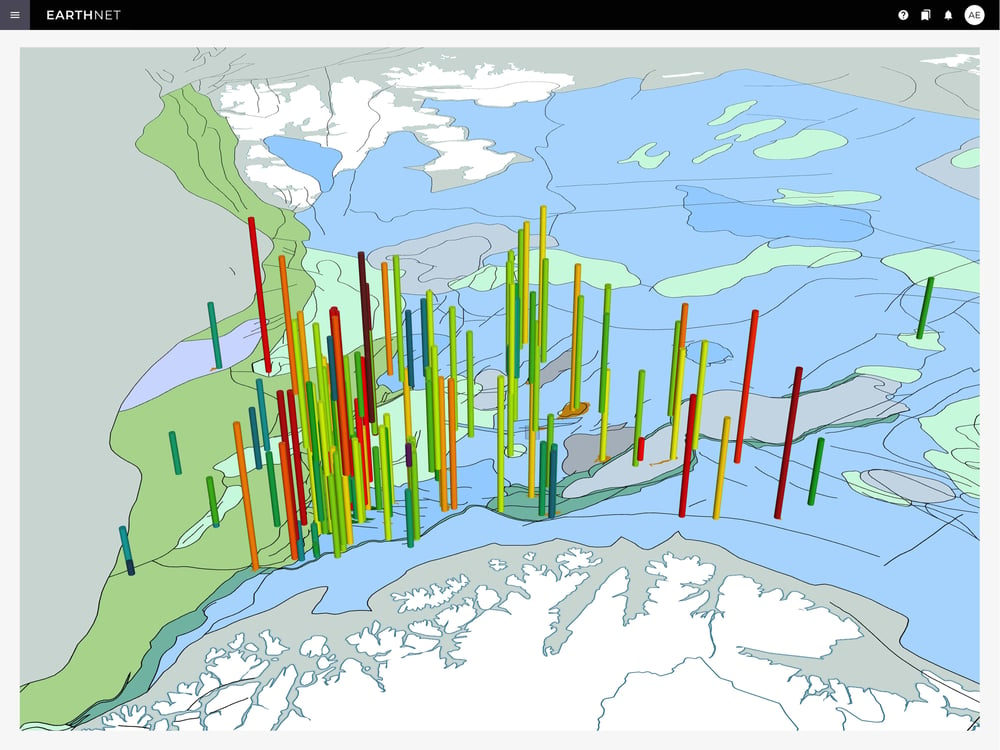
Seismic visualisations
Visualise your seismic data in 2D, 3D, and on maps to get a better sense of the structural and stratigraphic complexity of the subsurface. You can also visualise your seismic together with horizons, surfaces, faults, geobodies, and attributes.
Keep storage costs low by using our attributes on the fly functionality, enabling you to manipulate seismic data live without needing to store the output.
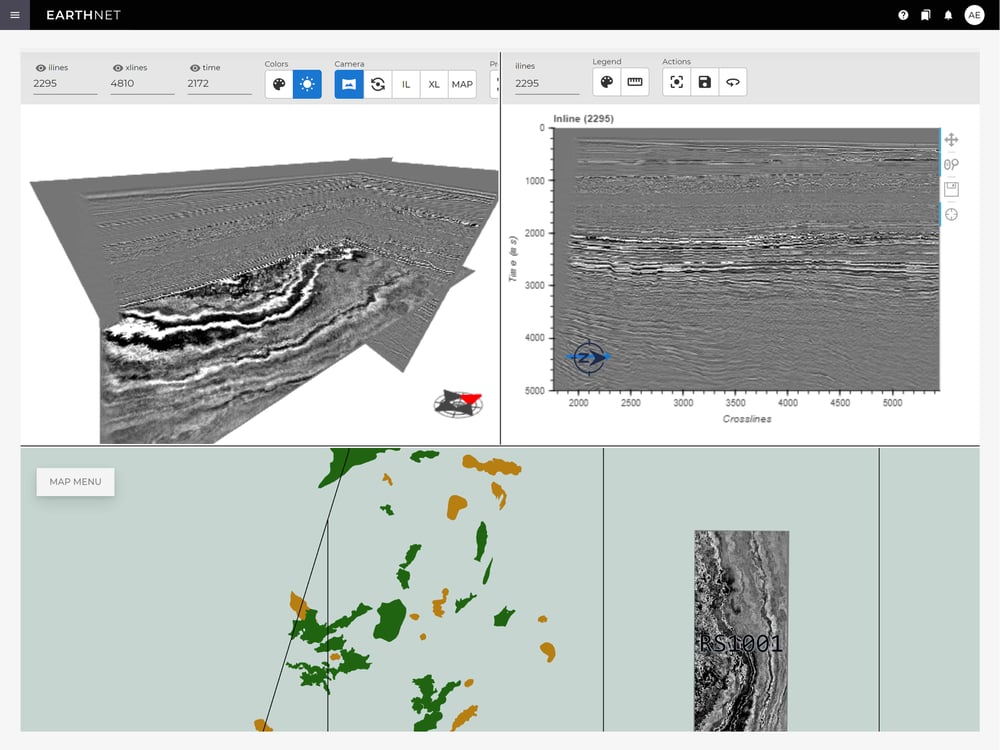
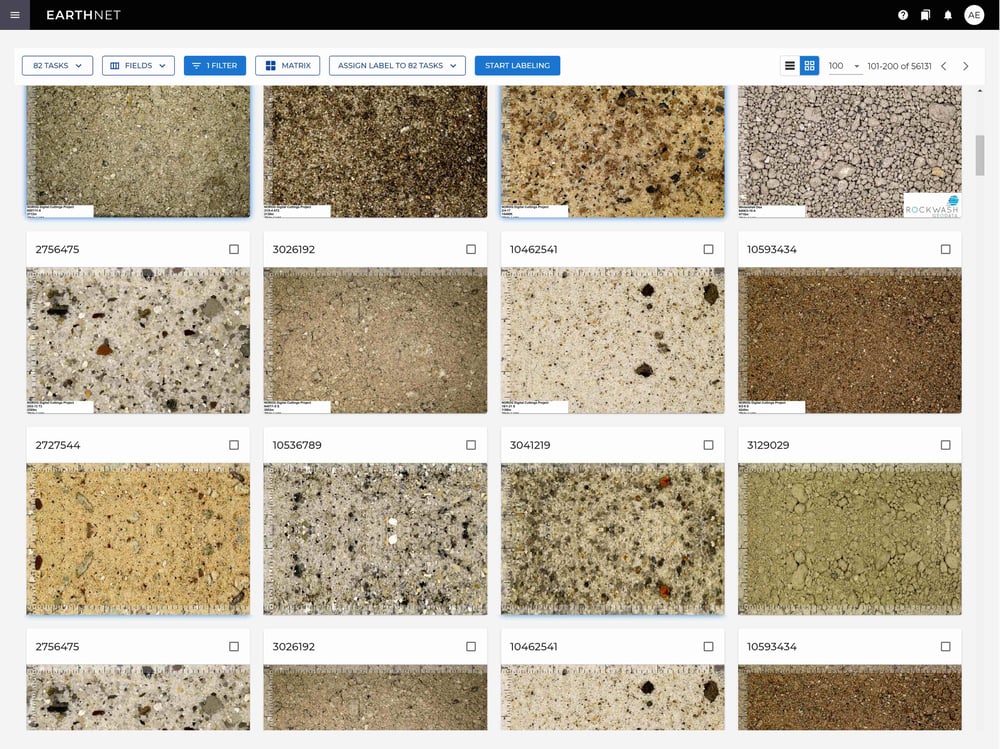
Image visualisations
EarthNET Viewer offers multiple filters based on metadata to help you easily locate the image data you need.
Once you've found the image data of interest, you can then visualise it in a variety of ways, including list-view together with metadata, grid view, or high resolution display. You can also visualise image data together with well logs, providing valuable context and enabling you to better understand the subsurface.
Interactive slidestories
Ditch static screenshots and present your data in a dynamic way with EarthNET Viewer's interactive slidestories.
Let your data do the talking and save your visualisations as interactive slides with full reproducibility for a more engaging presentation.
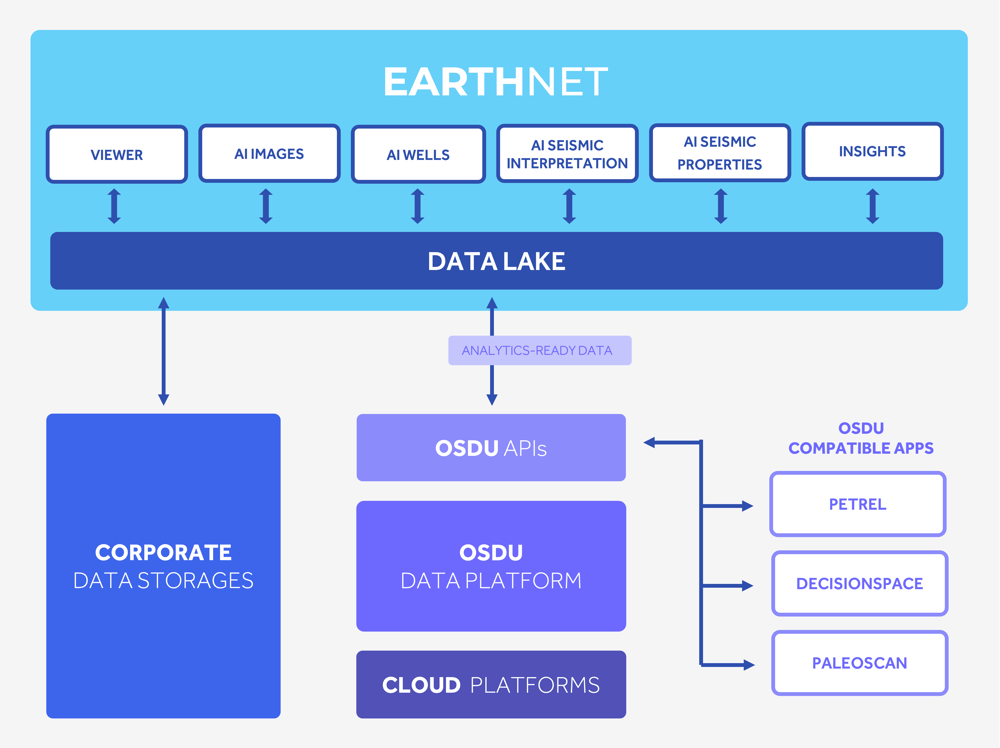
Integration with the OSDU™ Data Platform
The Open Subsurface Data Universe (OSDU) is an industry initiative to standardise the way subsurface data is stored and shared across the energy industry.
With EarthNET, you don't need to duplicate data in order to visualise it. Through our integration with the OSDU™ Data Platform, you can easily visualise data directly from the OSDU™ in the EarthNET Viewer, which is not possible using desktop software.


Get in touch
We are dedicated to helping our clients unleash the full potential of their data.
Let's talk about the opportunities, and explore how we can assist you.
